Aviation Safety - Presentation Demo
Aletheia is a GraphRAG platform designed for domain-specific analytical reasoning over knowledge graphs.
It provides the following capabilities:
- Data Ingestion across multiple domain-specific knowledge graphs
- Schema inference mechanisms based on LLMs and Ontologies
- Entities and Relationships Extraction, normalization and deduplication
- Hybrid search: Graph traversal plus semantic embeddings
- Temporal relationships
- Embedded ontology access for domain-aware reasoning
- Direct Cypher analytics with validation and sanitization
- Cross-graph reasoning across independent knowledge domains
- MCP connectors with self-describing, schema-aware tool interfaces
A. Why Safety Analysts Need Every Detail
The Swiss Cheese Model
Aviation safety operates on a fundamental principle: accidents don't happen because of a single failure. James Reason's Swiss Cheese Model explains how accidents occur in complex systems through the alignment of multiple weaknesses.
                  HAZARD
                    │
                    ▼
            ┌───────────────┐
            │   ░░░░░░░░░   │  ← Layer 1: Procedures
            │ ░░░░░  ░░░░░░ │     (hole: outdated checklist)
            └───────────────┘
                    │
                    ▼
            ┌───────────────┐
            │  ░░░░░░░░░░░  │  ← Layer 2: Technology
            │ ░░░░  ░░░░░░░ │     (hole: sensor calibration)
            └───────────────┘
                    │
                    ▼
            ┌───────────────┐
            │   ░░░░░░░░░   │  ← Layer 3: Training
            │ ░░░░░░░  ░░░░ │     (hole: CRM gap)
            └───────────────┘
                    │
                    ▼
              ⚠️ ACCIDENT
        (when holes align)
Each "slice of cheese" represents a defense layer (procedures, technology, training, supervision), and the "holes" are inherent weaknesses. An accident occurs only when holes in multiple layers align, allowing a hazard to traverse the entire system.
| Component | Description |
|---|---|
| Defense Layers | Barriers like regulations, equipment, training, supervision |
| Holes (Weaknesses) | Human errors, technical failures, design flaws |
| Active Failures | Direct actions that trigger events (e.g., skipping a checklist item) |
| Latent Failures | Deep systemic defects waiting to be activated (e.g., poorly designed procedure) |
Systemic Thinking
The model shifts focus from individual blame to systemic analysis. Errors are symptoms of deeper organizational and technical weaknesses that must be identified to prevent recurrence.
Why This Matters for GraphRAG
Safety analysts investigating incidents need to:
- Trace causal chains — From latent conditions through active failures to the accident
- Identify contributing factors — Weather, human factors, maintenance, equipment
- Connect related incidents — Similar failures across different contexts
- Find patterns — Recurring weaknesses in defense layers
This requires navigating relationships across multiple entities — exactly what GraphRAG enables. A simple keyword search cannot connect a maintenance procedure gap in Lyon with a similar QA failure in Palma de Mallorca. A knowledge graph can.
B. Why GraphRAG and not RAG?
RAG (Vector stores) allow AI to find conceptually similar information through embeddings: keyword search on steroids. Vector search measures proximity in semantic meaning, not structure or causality.
RAG is fast, scalable, and excellent for recall, but it doesn't understand relationships. RAG can tell you what looks alike, not what belongs together.
The Need for Structure
To move beyond pure semantic retrieval, AI needs a structured representation of meaning.
A way to connect facts, follow relationships, and reason across them.
That's where Knowledge Graphs come in.
C. Introducing EASA ECCAIRS for Aviation Safety
ECCAIRS (European Coordination Centre for Accident and Incident Reporting Systems) is the European framework used to collect, manage, and analyze aviation safety occurrences.
It covers:
- Standardized procedures for reporting incidents by aviation stakeholders
- Centralized and consolidated occurrence database where reports are stored and shared
- Common aviation safety taxonomy that structures how events, causes, and contributing factors are described
Together, these elements ensure consistency, comparability, and regulatory alignment in safety data across Europe.
What is an Occurrence?
An occurrence is the formal record of any aviation safety-related incident or event. It combines:
| Component | Description |
|---|---|
| Structured section | Based on the ECCAIRS taxonomy - encodes factual data such as event type, phases of flight, actors, and contributing factors |
| Narrative section | Free-text written in natural human language describing what actually happened, sometimes in different languages |
Together, the structured data enables large-scale analysis and comparability, while the narrative preserves context, nuance, and operational detail that cannot be fully captured by predefined fields.
Domain Complexity
Aviation safety occurrences form a highly specialized niche domain, characterized by dense technical language, extensive use of acronyms, and domain-specific jargon rooted in operations, engineering, and regulation.
ECCAIRS in Aletheia, post-2026-05-02
The full ECCAIRS Aviation 7.1.0.2 taxonomy — 540 classes plus ~204,000 controlled-value individuals (occurrence categories, ATA chapters, flight phases, weather phenomena, …) — is loaded as a searchable knowledge graph (ontology_eccairs). search_ontology("SCF-NP") returns the System/Component Failure (Non-Powerplant) individual; search_ontology("ATA 29 hydraulic") returns the hydraulic-power chapter and its sub-chapters. The analyst can speak in code (Q6 in Section K) and the system decodes against the actual ontology.
D. ECCAIRS Ontology
Although it is published as a taxonomy rather than a formal ontology, the ECCAIRS model can be directly transformed into an ontology that describes the aviation safety domain.
It defines core domain concepts such as:
- Occurrence
- Runway
- Aircraft
- Engine
- Flight Crew Member
- Aerodrome
The resulting ontology represents a highly specialized domain vocabulary, using precise and formal terminology. For instance, Aerodrome is the canonical term covering airports, heliports, and other landing areas, reflecting the regulatory need for unambiguous and standardized language.
Ontology graph by the numbers: 540 classes, ~204,592 controlled-value individuals, ~205,132 nodes total in ontology_eccairs.
E. Occurrence Dataset
The aviation safety corpus has been engineered for analyst-grade demonstration. It contains 100 markdown incident reports under use_cases/aviation_safety/data/:
- 22 hand-authored cluster reports — four deliberate patterns planted to support multi-hop and cross-graph reasoning:
| Cluster | Reports | Pattern |
|---|---|---|
| A — Operator systemic | 6 | Iberia A320-family hydraulic-line fatigue near a mounting bracket; all maintenance traces back to the Madrid base |
| B — Aircraft fleet defect | 5 | Embraer ERJ-195 DMC software anomaly under a specific approach + flap configuration; spans 5 operators / 5 airports |
| C — Airport environment | 7 | Frankfurt EDDF runway 25L approach bird strikes during the autumn migration window |
| D — Recommendation recurrence | 4 | EASA-SR-2024-091-03 issued from a TAP/Lisbon source incident; recurs at Vienna, Zurich, Amsterdam at operators that did not implement it |
-
68 LLM-generated noise reports — produced by
scripts/generate_aviation_corpus.pyfrom a committed parameter table, validated throughAviationSafetyParser. The noise raises retrieval pressure without diluting cluster signals. -
9 multilingual reports (Spanish, French, German, Italian) embedded in the noise to demonstrate cross-language semantic search.
Structured fields use ECCAIRS canonical labels (Flight phase ∈ {Approach, En route, Landing, Manoeuvring, Standing, Take-off, Taxi, …}; Aircraft damage ∈ {None, Minor, Substantial, Destroyed, …}; Injury level ∈ {None, Minor, Serious, Fatal, …}). The cheatsheet lives at use_cases/aviation_safety/ontology_controlled_values.md.
Sample Document
Incident Report 2024-0856-EU
Metadata
| Field | Value |
|---|---|
| Incident ID | 2024-0856-EU |
| Date | 2024-11-25 |
| Time | 19:33 UTC |
| Location | Barcelona-El Prat Airport (LEBL) |
| Country | Spain |
| Flight Phase | Cruise / En route |
Aircraft
| Field | Value |
|---|---|
| Type | Boeing 787-9 |
| Registration | EC-NBM |
| Operator | Air Europa |
Incident Description
Durante el vuelo de crucero a FL390 sobre el Mediterráneo occidental, aproximadamente 120 nm al este de Barcelona, la tripulación detectó un olor inusual a humo eléctrico en la cabina de vuelo. El comandante ordenó inmediatamente el uso de máscaras de oxígeno y declaró una emergencia (MAYDAY).
Se ejecutó el procedimiento de humo/fuego/vapores del QRH (Quick Reference Handbook). La tripulación identificó que el olor provenía del sistema de entretenimiento a bordo (IFE) en la cabina. El sistema IFE fue desactivado y el olor cesó gradualmente.
Findings
- Primary Cause: Cortocircuito eléctrico en la unidad de distribución de energía del sistema IFE
- Contributing Factors: Aging electrical components, possible moisture ingress
- Human Factors: Correct application of emergency procedures by flight crew
F. The Challenge
The challenge for Aletheia is to generate accurate answers given the combined characteristics of both the input data and the questions.
Data Challenges
| Aspect | Challenges |
|---|---|
| Both | Multiple languages, typos, abbreviations, inconsistent phrasing, highly technical aviation jargon |
| Input Data | Combines structured and unstructured information, may not align with ECCAIRS ontology (e.g., airport vs. aerodrome) |
| Questions | Can be ambiguous (e.g., referring to cities instead of aerodromes), may require multi-hop or temporal reasoning |
Example Query
A question such as "What incidents in Barcelona or Madrid involved Boeing aircraft and resulted in emergency declarations (MAYDAY or PAN-PAN)?" must resolve to a single incident matching all criteria:
| Field | Value |
|---|---|
| Location | Barcelona-El Prat Airport (LEBL) |
| Date | 2024-11-25 |
| Aircraft | Boeing 787-9 (EC-NBM) |
| Operator | Air Europa |
| Emergency | MAYDAY declared |
| Cause | Electrical short circuit in IFE power distribution unit |
| Outcome | Diverted to Barcelona, emergency landing, no injuries |
The Madrid incident (2024-0734-EU) involved an Airbus A330-200, not Boeing, so it doesn't match.
G. The Knowledge Graphs
Aletheia's aviation safety use case spans three independent knowledge graphs, each built from different data sources and covering a distinct regulatory domain.
Three Domains, One Analytical Platform
| Graph | Domain | Source | Purpose |
|---|---|---|---|
| Aviation Safety | 2024 European occurrences | Synthetic ECCAIRS-style reports | What happened — incidents, aircraft, operators, locations |
| Safety Recommendations | EASA Safety Recommendations | EASA SR database | What was recommended — investigation findings and corrective actions |
| Airworthiness Directives | EASA Airworthiness Directives | EASA AD database | What was mandated — mandatory inspections, modifications, and operational limits |
These three datasets mirror the real-world safety lifecycle: an incident triggers an investigation that produces recommendations, which may escalate to mandatory directives. In practice, analysts must cross-reference these databases manually. Aletheia connects them through knowledge graphs.
No Pre-Built Links
The three knowledge graphs are built independently from separate data sources. There are no pre-built cross-references between them. Aletheia bridges the gaps through entity resolution, semantic search, and ontology-informed reasoning at query time.
Aviation Safety Graph
100 European aviation occurrences from 2024, with multilingual narratives (English, Spanish, French, German, Italian).
Entities:
| Type | Count |
|---|---|
| Occurrence | 100 |
| Aircraft | ~95 |
| AerodromeGeneral | ~60 |
| Operator | ~55 |
| Manufacturer | ~30 |
| Country | ~20 |
Relationships:
| Relationship | Description | Count |
|---|---|---|
| INVOLVED_AIRCRAFT | Occurrence → Aircraft | 9 |
| OCCURRED_AT | Occurrence → Aerodrome | 10 |
| LOCATED_IN | Aerodrome → Country | 10 |
| OPERATED_BY | Aircraft → Operator | 10 |
| MANUFACTURED_BY | Aircraft → Manufacturer | 10 |
Safety Recommendations Graph
~243 EASA Safety Recommendations linked to 138 occurrences, issued by 37 investigation authorities across 24 countries.
Entities:
| Type | Count |
|---|---|
| Occurrence | 138 |
| Aircraft | 237 |
| SafetyRecommendation | ~243 |
| Manufacturer | 59 |
| SafetyInvestigationAuthority | 37 |
| Country | 24 |
Relationships:
| Relationship | Description | Count |
|---|---|---|
| STEMS_FROM | SafetyRecommendation → Occurrence | 242 |
| ISSUES | SafetyInvestigationAuthority → SafetyRecommendation | 158 |
| INVOLVES | Occurrence → Aircraft | 147 |
| LOCATES | SafetyInvestigationAuthority → Country | 137 |
| MANUFACTURES | Manufacturer → Aircraft | 131 |
Airworthiness Directives Graph
~1,000 EASA Airworthiness Directives covering 331 aircraft types, referencing 228 technical documents, approved by 137 design approval holders.
Entities:
| Type | Count |
|---|---|
| AirworthinessDirective | ~1,000 |
| AircraftType | 331 |
| Document | 228 |
| DesignApprovalHolder | 137 |
Relationships:
| Relationship | Description | Count |
|---|---|---|
| APPROVED_BY | AirworthinessDirective → DesignApprovalHolder | 759 |
| APPLIES_TO | AirworthinessDirective → AircraftType | 677 |
| REFERENCES | AirworthinessDirective → Document | 199 |
| SUPERSEDES | AirworthinessDirective → AirworthinessDirective | 81 |
Scale
Combined, the three graphs contain over 2,000 entities and 5,000+ typed relationships. The Airworthiness Directives graph alone is larger than many production GraphRAG deployments.
Knowledge Graph Visualization
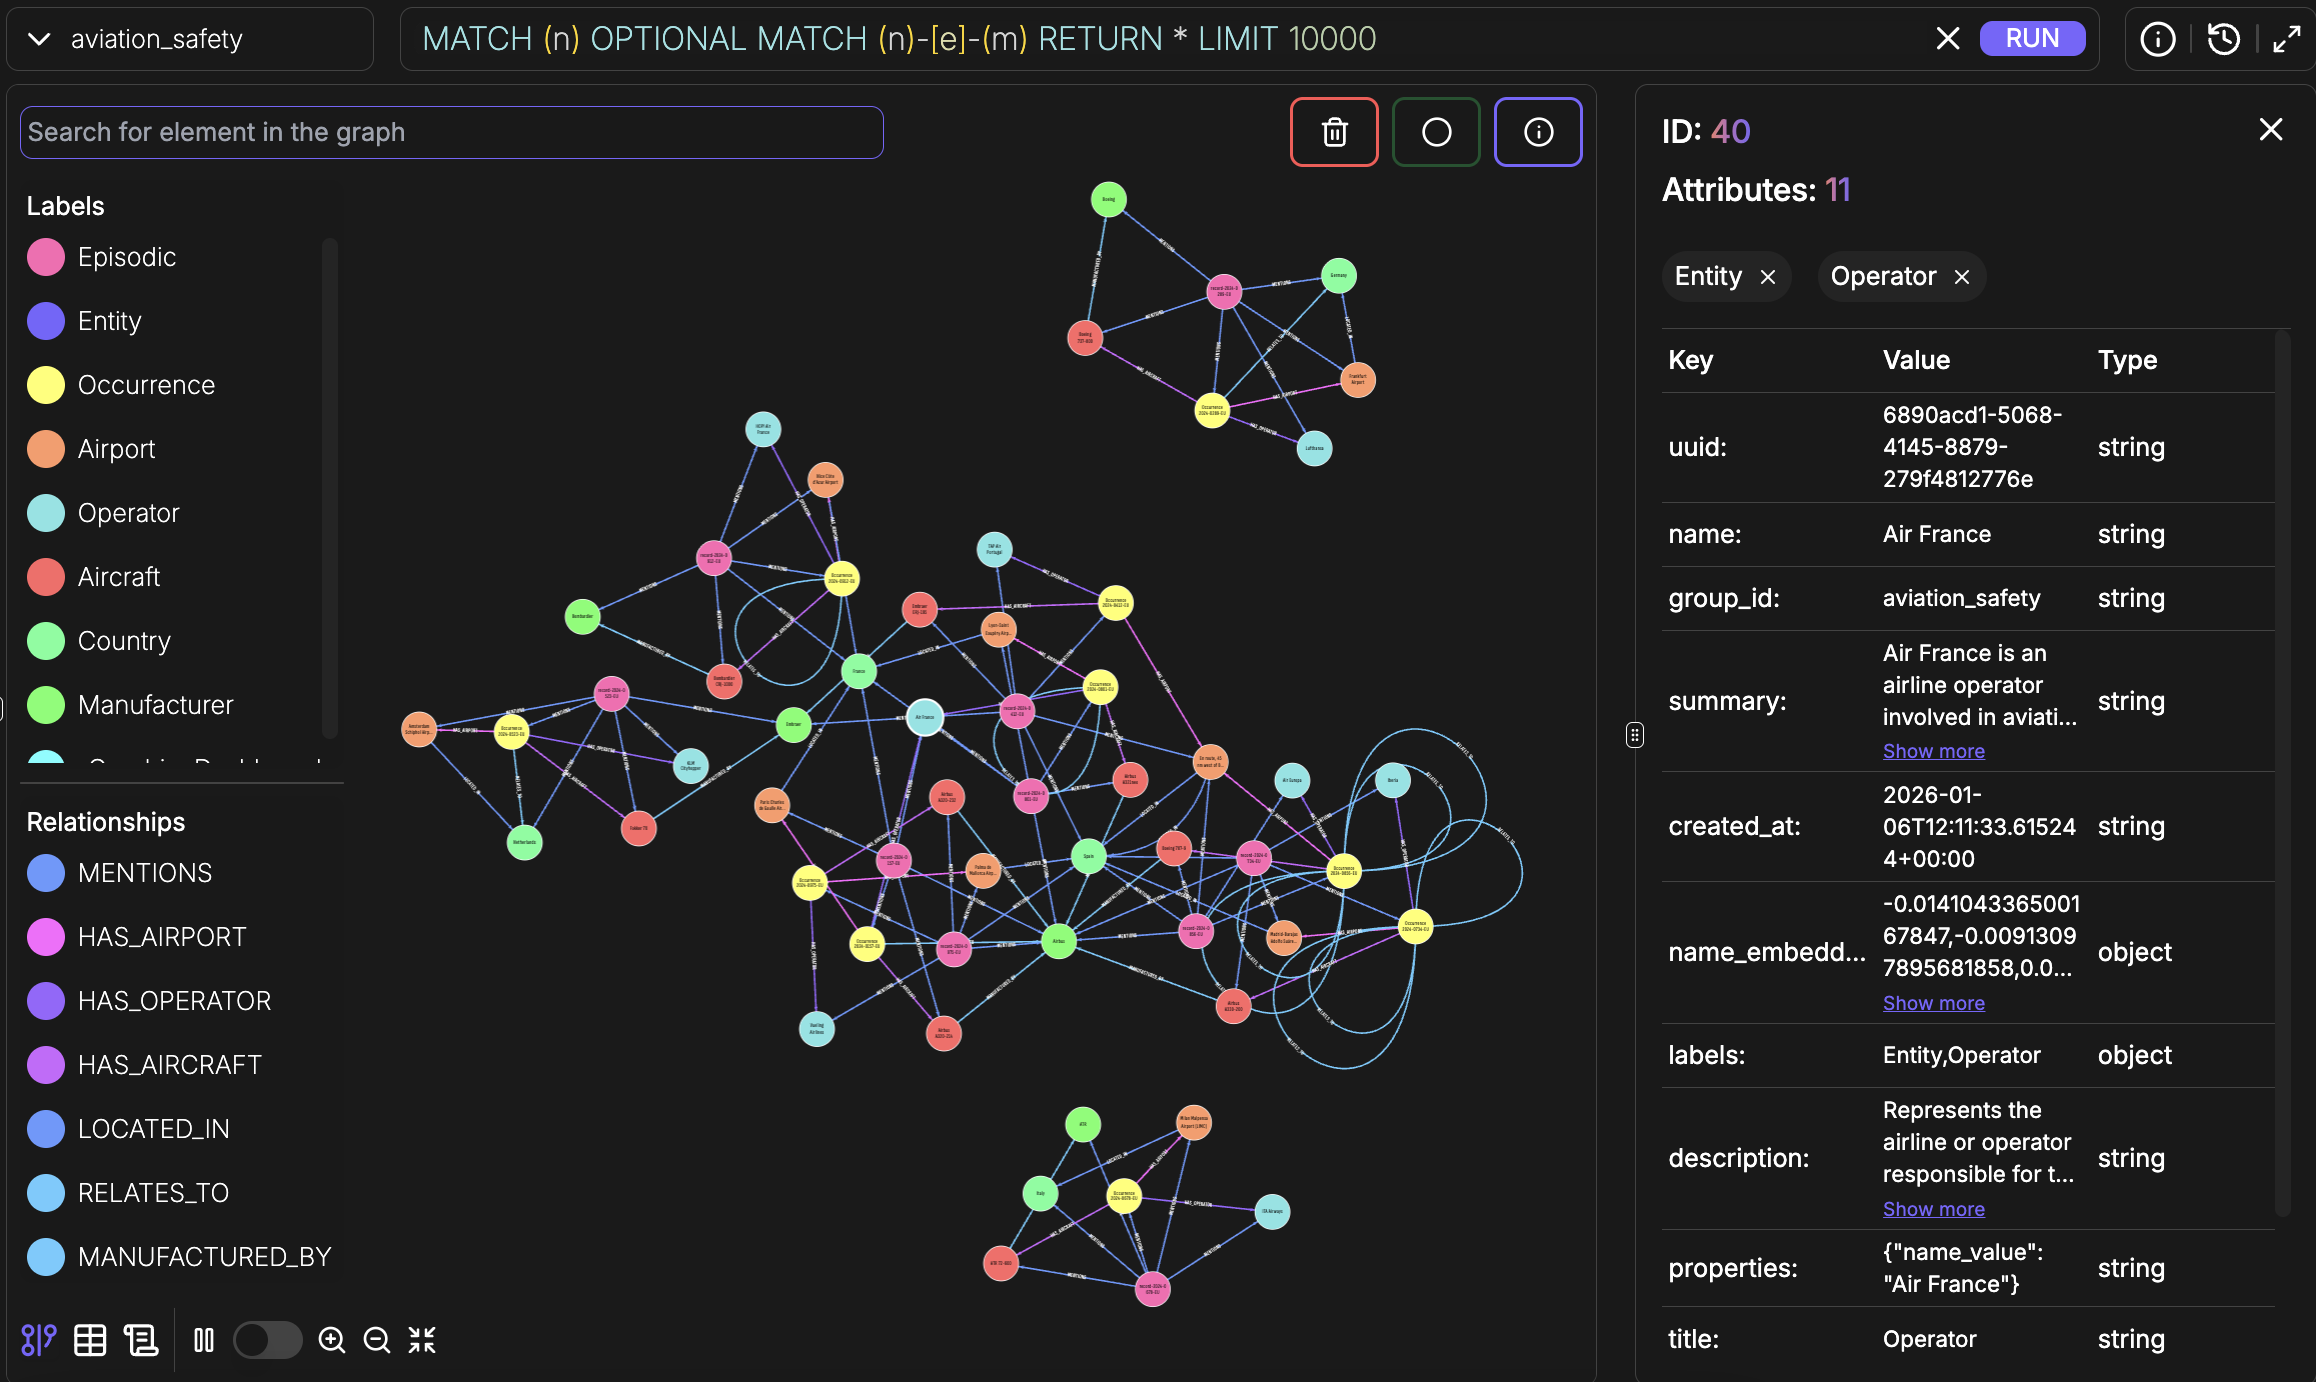
FalkorDB Graph Explorer
H. Building the Knowledge Graphs
When building a knowledge graph, an LLM is used to extract entities and relationships from text.
Without schema guidance, this process easily leads to inconsistent entity types, ambiguous relationships, and fragmented vocabularies, resulting in a graph that lacks structural coherence.
Why Schema Matters
| Benefit | Description |
|---|---|
| Type consistency | Identical concepts use the same canonical types |
| Relationship clarity | Relationships follow a clear, queryable vocabulary |
| Property standardization | Attributes are named consistently across entities |
| Improved retrieval | Queries reliably return all relevant results |
Schema Inference in Aletheia
Schema inference determines the vocabulary of entity types, relationships, and properties that the LLM must use during extraction.
The most robust approach combines LLM-assisted schema inference with domain ontologies. In this model:
- LLM-driven schema discovery
- Semantic alignment with existing ontology through knowledge graph search and embeddings
- Automatic resolution of terminology mismatches
This hybrid approach enables the extraction of high-confidence schemas, enriched and constrained by authoritative domain knowledge.
Inferred Schemas
Each knowledge graph has its own domain-specific schema, inferred through the same ontology-guided process.
Aviation Safety Schema
Safety Recommendations Schema
Airworthiness Directives Schema
Ingestion Process
Reproducible materialization
The 100-report corpus is reproducible from committed sources: 22 hand-authored cluster seeds in cluster_seeds/ plus a 68-row parameter YAML at scripts/aviation_noise_params.yaml. Run python scripts/generate_aviation_corpus.py to regenerate data/ from scratch (~10 min plus LLM costs for the noise reports).
I. ECCAIRS Ontology Graph
Ontologies encode expert knowledge about a domain.
In the context of knowledge graphs, an ontology serves as a schema or blueprint that describes:
| Component | Description |
|---|---|
| Classes | The types of entities (e.g., Person, Organization, Aircraft) |
| Properties | Attributes of entities (e.g., name, date, location) |
| Relationships | How entities connect to each other |
| Constraints | Rules about valid combinations |
The Terminology Problem
Without ontology alignment, inconsistencies arise:
| User Language | Ontology Term |
|---|---|
| Airport | Aerodrome |
| Aircraft, Plane, Airplane | Aircraft |
| Operator, Airline, Carrier | Operator |
| Occurrence, Incident, Event | Occurrence |
Ontology Graph Solution
How can we link an entity (like airport) with the corresponding ontology class (aerodrome)?
Aletheia provides the ability to build an ontology graph — a semantic projection of a formal ontology that enables the system to access domain knowledge through embeddings and graph search.
The ontology graph is built before the knowledge graph, ensuring schema inference can rely on it.
During schema inference, when detecting an "Airport" entity, Aletheia queries the ontology graph using semantic search to find the matching canonical class ("Aerodrome").
Ontology Graph in FalkorDB
ECCAIRS Ontology Structure
Ontology in the MCP Connector
The ECCAIRS ontology graph is not just a build-time tool. Each Aletheia MCP connector provides embedded ontology access through search_ontology and explore_ontology tools, enabling the LLM to decode domain terminology at query time — directly from within any data connector.
Searching the ECCAIRS ontology
The ontology graph is queried like any other Aletheia graph. Two examples used live in the demo:
search_ontology("SCF-NP")
→ "SCF-NP: System/component failure or malfunction [non-powerplant]"
   (Occurrence categoryValue individual)

search_ontology("ATA 29 hydraulic power")
→ "2900 Hydraulic power system" (level 2)
→ "2910 Hydraulic main system" (level 3)
→ "Hydraulic main system line/fitting" (level 4)
These individual nodes are wired by INSTANCE_OF edges to their parent value classes (e.g., Occurrence_categoryValue, Ata_chapterValue), so kg_explore_node can pivot from an individual to its peers in the same enumeration.
J. The MCP Connector
Aletheia exposes each knowledge graph through a self-describing MCP (Model Context Protocol) connector — a standardized interface that allows any LLM to discover, search, traverse, and analyze the graph.
Each connector is domain-aware: it advertises what entity types, relationship types, and query patterns exist in its graph, enabling the LLM to generate precise queries without guessing at graph structure.
Tool Surface
Each connector provides 13 tools organized into five capability groups:
| Group | Tools | Purpose |
|---|---|---|
| Semantic Discovery | search, explore_node | Find entities by meaning, traverse graph neighborhoods |
| Schema & Ontology | get_schema, search_ontology, explore_ontology | Understand graph structure, decode domain terminology |
| Cypher Analytics | run_cypher | Count, aggregate, compare, compute — direct analytical queries |
| Community Intelligence | build_communities | Cluster entities, detect thematic groups |
| Data Management | add_memory, get_episodes, get_episode_context, delete_entity_edge, delete_episode, clear_graph, get_status | Ingest, inspect, maintain |
Search Capabilities
The search tool provides unified access to nodes, edges, and communities with advanced filtering:
| Feature | Description |
|---|---|
| Entity type filtering | Restrict results to specific types (e.g., only SafetyRecommendation entities) |
| Edge type filtering | Search for specific relationships (e.g., only STEMS_FROM edges) |
| Reranker strategies | Five ranking algorithms: reciprocal rank fusion, diversity ranking, cross-encoder precision, graph proximity, and importance ranking |
| Graph-proximity search | Bias results toward a known entity's neighborhood using center_node_uuid |
| BFS from known entities | Breadth-first graph traversal starting from specific nodes |
| Temporal filtering | Query edges valid at a specific point in time |
| Community search | Search across detected entity clusters |
Cypher Analytics
The run_cypher tool executes read-only Cypher queries with a four-stage validation pipeline:
LLM generates Cypher
        │
        ▼
┌─ Stage 1: LLM Fixups ─────────────┐
│  Smart quotes, unicode, missing    │
│  RETURN clause, direction fixes    │
└────────────────────────────────────┘
        │
        ▼
┌─ Stage 2: FalkorDB Dialect ────────┐
│  Auto-fix: date(), toLower, etc.   │
│  Reject: APOC, pattern comp., etc. │
└────────────────────────────────────┘
        │
        ▼
┌─ Stage 3: Security Whitelist ──────┐
│  Only: MATCH, WHERE, RETURN, WITH  │
│  Reject all write operations       │
└────────────────────────────────────┘
        │
        ▼
┌─ Stage 4: Safety Injection ────────┐
│  Auto-inject LIMIT, timeout        │
└────────────────────────────────────┘
        │
        ▼
   GRAPH.RO_QUERY (database-level
   read-only enforcement)
Results are returned as typed JSON envelopes (scalar, tabular, graph, or path) with metadata including row count, truncation status, execution time, and a list of any auto-corrections applied to the query.
Embedded Ontology Access
Every data connector includes search_ontology and explore_ontology tools that query the ECCAIRS ontology directly. The LLM can decode aviation shorthand (e.g., "SCF-NP" → "System/Component Failure - Non-Powerplant", "ATA 36" → "Pneumatic system") without switching to a separate ontology server.
Self-Describing Connectors
Each connector advertises its domain schema in the tool metadata. For example, the Safety Recommendations connector tells the LLM:
Entity types: Aircraft, Country, Manufacturer, Occurrence,
              SafetyInvestigationAuthority, SafetyRecommendation

Edge types:   INVOLVES, ISSUES, LOCATES, MANUFACTURES, STEMS_FROM
This means the LLM knows — before making any query — that STEMS_FROM connects SafetyRecommendation to Occurrence, that ISSUES connects SafetyInvestigationAuthority to SafetyRecommendation, and so on. It can write precise filtered searches and valid Cypher queries on the first attempt.
Discovery + Analytics
The combination of semantic search for discovery ("find me relevant entities") and Cypher for analytics ("count, aggregate, prove") means the LLM can handle both exploratory and computational questions through the same connector.
K. Aletheia in Action
The demo follows an analyst's actual workflow over a quarter's worth of incidents: triage the corpus, surface anomalies, narrow to one, escalate to a structured investigation, and close on a budget-bounded decision. The four blocks correspond to the analyst's mental model — "What's recurring? Why? What should we do? What can we afford?" — not to a tour of capabilities.
Each block is presenter-ready. Italics under a query describe what the system does before output appears. Admonition boxes labelled Live presenter mark moments where latency or autonomy needs framing for the audience.
Chat structure
The 21 questions run across six chats. Each boundary is a real topic shift — splitting the chats keeps each LLM context window focused on what the analyst is doing right now and avoids cross-talk between unrelated tool results.
| Chat | Questions | What's in it | Why a fresh chat |
|---|---|---|---|
| 1 | Q1–Q4 | Triage table → save → live edit → chart | The four artifacts share Q1's aggregation result; one continuous turn keeps that data in context. |
| 2 | Q5–Q6 | Map + ECCAIRS jargon pivot | New visual pivots; Q6's search_ontology calls don't need Q1–Q4's chart context cluttering the prompt. |
| 3 | Q7–Q10 | Iberia operator deep-dive (timeline → profile → cross-graph → save) | Block boundary. The two new connectors (safety_recommendations, airworthiness_directives) come into play; reset to start with a clean tool surface. |
| 4 | Q11–Q12 | Network graph as independent UI artifact + save | graph_build returns a large structured payload; isolating it from Q7–Q10's Cypher results keeps the LLM context under the 200K-token ceiling. |
| 5 | Q13–Q17 | Structured investigation: briefing → elicitation → reasoning agent → save | The briefing's elicitation flow and Phronesis investigation are one continuous conversation by design. |
| 6 | Q18–Q21 | Euboulia decision pipeline (8 stages) | Decision flow is one continuous conversation by design — each pipeline stage's output feeds the next. |
Inline markers in the script (🆕 **New chat**) flag each transition.
Block 1 — "Patterns of the quarter"
Single graph (aviation_safety). Goal: triage 2024 occurrences, surface a mosaic of anomalies, demonstrate the workspace UX (table → chart → map, save artifacts, edit live), and end on the ontology-jargon question that picks one anomaly to drill into.
Block opener. "We've ingested every 2024 occurrence into the aviation safety graph — 100 reports across the EU. Before drilling anywhere, I want to know what patterns are recurring this quarter."
Q1 — Triage table
"What recurring failure patterns do you see in our 2024 occurrences? Group by primary cause family and operator. Include incident count, severity distribution, and the airports involved."
The system runs a Cypher aggregation; the table renders inline in the chat.
| Capability | What's being tested |
|---|---|
| Schema-aware aggregation | Group-by across multiple entity types |
| Severity bucketing | The Aircraft Damage and Injuries fields are read as ECCAIRS canonical tokens |
| Airport rollup | Multi-airport patterns surface in the same row |
The top three patterns surface visibly: the Iberia hydraulic cluster, the Embraer ERJ-195 DMC software anomaly, and the Frankfurt EDDF autumn bird strikes.
Q2 — Save the table to the workspace
"Save that as a document called 'Recurring Patterns 2024' under a folder named '2025 Annual Review'."
A new folder appears in the workspace tree; the table renders as a saved markdown document.
📁 Workspace now contains: - 2025 Annual Review/Recurring Patterns 2024.md
Q3 — Live edit the saved document
"Keep only the top three patterns. Drop the long tail."
The saved document re-renders in place; the workspace tree timestamp updates.
| Capability | What's being tested |
|---|---|
| In-place artifact editing | The saved doc is a live artifact, not a snapshot |
Q4 — Chart by operator
"Now show me a chart: severity-weighted incident frequency, top operators on the X axis, the three patterns stacked."
A bar chart renders; the chart is itself savable.
| Capability | What's being tested |
|---|---|
| Workbench chart visualization | Native chart from a structured query result |
| Stacked-by-pattern reading | Operator + cause-family is a visual two-key cross-tab |
The Iberia bar towers over the others on the hydraulic stack. Operators of Embraer ERJ-195 cluster vertically. Frankfurt EDDF arrivals cluster on the Lufthansa/Ryanair/KLM/Eurowings/Condor bars.
🆕 New chat — chat 2 of 6
Open a fresh chat in the workbench before Q5. Q1–Q4 share Q1's aggregation result and the saved triage doc; Q5's map and Q6's ontology pivot start a different visual+ontology thread, and a fresh chat keeps the LLM context focused on the geocoder + ECCAIRS lookups.
Q5 — Map the incidents
"Plot the incidents on a map, color-coded by pattern."
A map renders with markers colored by cluster; the geocoder resolves airport names to coordinates.
| Capability | What's being tested |
|---|---|
| Geocoding from airport names + ICAO codes | No pre-stored coordinates — resolved via the geocoder MCP |
| Map UI as an independent visualization component | First-class artifact, savable |
The Iberia hydraulic cluster traces an Iberian-peninsula + southern-European footprint. The ERJ-195 DMC events spread across northern Europe. The Frankfurt cluster is a single dense pin.
Q6 — ECCAIRS jargon focus pivot (showpiece)
"Any SCF-NP events on Airbus A320-family aircraft involving the hydraulic system during take-off and landing in 2024? Decode SCF-NP and the flight-phase codes against the ECCAIRS ontology. Which operator concentrates the cluster?"
The system queries the ECCAIRS ontology graph: search_ontology("SCF-NP") returns the System/Component Failure (Non-Powerplant) individual; search_ontology("Take-off"/"Landing") returns the matching Flight_phaseValue individuals. Then a Cypher query against aviation_safety filters by aircraft-type prefix and flight-phase tokens. The narrative answer is at analyst register — codes are decoded inline.
| Capability | What's being tested |
|---|---|
| Ontology-as-decoder | ECCAIRS individuals (post-PR1) are real searchable nodes; the LLM does not rely on pretraining for code decoding |
| Multi-attribute Cypher filter | Aircraft type + flight phase + cause family in a single aggregation |
| Domain register | The answer reads as a safety analyst would write it, not as a chatbot |
The cluster surfaces clearly: Iberia, six A320-family hydraulic-line incidents, six airports.
Live presenter
The ontology decode is the technical showpiece of Block 1. If search_ontology returns slowly (rare; it's vector-indexed but the first call after a cold start can take ~2s), use the moment to point out that ECCAIRS as a graph means every code in the analyst's vocabulary is queryable — not just the ones the LLM was trained on.
Block close. "Iberia is the strongest signal. Let me drill into it."
Block 2 — "Iberia deep dive"
Multi-graph (aviation_safety + safety_recommendations + airworthiness_directives). Goal: build the operator picture, surface the regulatory gap, save findings, and visualize the network as an independent UI component.
Block opener. "Iberia, six hydraulic-line incidents on A320-family aircraft. I want the timeline first, then the operator's risk profile, then I'll cross to the regulators to see if anyone is covering this specific failure mode."
🆕 New chat — chat 3 of 6
Open a fresh chat in the workbench before Q7. Block 2 starts here — two new connectors (safety_recommendations, airworthiness_directives) come online; a clean chat means the LLM sees the full multi-graph tool surface without competing context from Block 1's aviation_safety-only queries.
Q7 — Operator timeline
"Show me Iberia's complete 2024 hydraulic timeline: incident, aircraft, airport, date, runway phase, severity."
A chronological table renders; one row per incident.
| Capability | What's being tested |
|---|---|
| Filtered Cypher with order-by-date | A focused timeline pulled from a 100-report corpus |
| Multi-column projection | Each row carries six fields the analyst needs at a glance |
Q8 — Operator profile
"Build Iberia's risk profile from this data: fleet composition involved, common contributing factors, maintenance organization signals, geographic spread."
The system aggregates contributing factors, maintenance references, and locations into a structured profile section. Execution is direct — the analyst does not want a briefing yet.
| Capability | What's being tested |
|---|---|
| Direct execution under request | "Build" is a verb of action; no briefing escalation |
| Multi-aspect aggregation | Profile spans four dimensions in one synthesis |
Prompt-design rationale
The wording "Build Iberia's risk profile from this data" is deliberate. The system has an Operator Risk Profile briefing template; if the analyst said "Profile Iberia" alone, the assistant might escalate to briefing creation. The phrase "from this data" combined with the imperative "Build" keeps execution direct. Briefing escalation is for Block 3.
Q9 — Cross-graph SR + AD coverage
"Cross-reference the safety_recommendations and airworthiness_directives graphs: any open EASA Safety Recommendation covering hydraulic-line fatigue near mounting-bracket attachments? Any active Airworthiness Directive on A320-family hydraulic-line inspection intervals or mounting-bracket attachments?"
The system fans out two parallel queries — one against safety_recommendations, one against airworthiness_directives. Results land in a two-column comparison.
| Capability | What's being tested |
|---|---|
| Cross-graph fan-out | Two graphs queried in one analyst turn |
| Coverage assessment | The synthesis reads as "regulation X is adjacent but doesn't cover this specific failure mode" |
The result reveals the regulatory gap. SR coverage of fixed-wing A320 hydraulic-line fatigue near mounting brackets is absent (the existing hydraulic SRs are AS 350 helicopter servo-transparency cases). AD coverage is adjacent: EASA AD 2024-0097 targets A318/A319/A320/A321 main-landing-gear door actuator fittings — but not the hydraulic-line/mounting-bracket pattern Iberia is showing.
Categorical-filter pitfall
kg_get_schema returns property names, not values. Different graphs use different vocabularies (status='Active' vs 'EFFECTIVE' vs 'Open'). Before equality-filtering on status, severity, phase, etc., the assistant calls kg_profile_graph first — every property with distinct_count < 20 returns its top values with frequencies, so the filter uses the corpus's actual canonical value. A wrong value silently zeros the result and produces a false "no coverage" conclusion.
Q10 — Save the findings
"Save these findings as 'Iberia hydraulic pattern' under the Annual Review folder."
A new document is added to the workspace.
📁 Workspace now contains: - 2025 Annual Review/Recurring Patterns 2024.md - 2025 Annual Review/Iberia hydraulic pattern.md
🆕 New chat — chat 4 of 6
Open a fresh chat in the workbench before Q11. graph_build returns a structured payload of nodes + edges that can run into the thousands of tokens; isolating it from Q7–Q10's Cypher results keeps the prompt under the 200K-token ceiling. A fresh chat also forces the LLM to re-read the schema before building the graph, which catches stale assumptions.
Q11 — Network graph (independent UI component)
"Show me Iberia's 2024 incident network as a graph: the operator at the center, first-degree links to aircraft and airports, second-degree to contributing factors and maintenance events."
The graph viewer opens as a separate workspace artifact. Edges are typed; the analyst can pan and zoom; clicking a node opens its details.
| Capability | What's being tested |
|---|---|
| Graph-viz UI as independent component | Like the map, the graph is a first-class artifact — not a one-off chat output |
| Mixed-degree neighborhood | First-degree (operator → aircraft/airport) + second-degree (contributing factors, maintenance) in one render |
This is the visual moment of Block 2. The graph shows the six aircraft fanning out from Iberia, the airports fanning out from each aircraft, and the contributing factors collapsing into a few common nodes — visually the systemic pattern is unmistakable.
Live presenter
Pause on the graph. The shared maintenance-organization node and the shared contributing-factor nodes are what the cross-graph queries (Q9) couldn't surface. Visual decomposition is the strength of an interactive graph view.
Recovery aside
If the graph viewer renders blank: refresh the workspace pane — the layout engine occasionally drops the first frame on cold load.
Q12 — Save the graph
"Save the graph in the Iberia folder."
The assistant offers two folder layouts: (a) create a new Iberia/ folder at the workspace root, or (b) save inside the existing 2025 Annual Review/ folder. The script chooses (a) create new Iberia folder — the workspace listings below assume a flat Iberia/ sibling. The assistant then writes the graph as Iberia/2024-incident-network.graph.
📁 Workspace now contains: - 2025 Annual Review/Recurring Patterns 2024.md - 2025 Annual Review/Iberia hydraulic pattern.md - Iberia/2024-incident-network.graph
Block close. "I have the operator picture and the regulatory gap. Time to escalate this to a structured investigation that leaves a PROV-O audit trail."
Block 3 — "Structured investigation"
Briefing creation + reasoning agent. Goal: introduce briefings explicitly. The analyst escalates to a scoped investigation with PROV-O auditing.
Block opener. "Manual queries will only get me so far. I want a structured, auditable investigation. The graph layer should plan and execute, and the briefing keeps the scope honest."
🆕 New chat — chat 5 of 6
Open a fresh chat in the workbench before Q13. The briefing flow + Phronesis investigation that follows is one continuous conversation through Q17 — do not open another chat mid-flow. A clean starting context is essential because the elicitation cards (Q14) and the reasoning loop (Q15) both build on the briefing's state machine; carrying over Block 2's tool results would confuse the briefing extractor.
Q13 — Trigger briefing creation
"I want to launch a structured investigation. Build me a consolidated risk briefing for Iberia across all three graphs."
The assistant offers the available aviation templates as structured options. The picker shows the five aviation-profile templates (Operator Risk Profile, Fleet Defect Investigation, Regulatory Gap Analysis, Recommendation Lifecycle Trace, Airport Safety Profile) plus the generic Investigation Briefing. The analyst selects Operator Risk Profile.
| Capability | What's being tested |
|---|---|
| Briefing template registry | Profile-aware — only aviation templates appear |
| Structured option presentation | Not free text; the picker is the right UI for the choice |
| Briefing-vs-direct disambiguation | The verb "launch a structured investigation" is what triggers escalation |
Q14 — Elicitation walkthrough (narrative beat)
The assistant's elicitation flow runs before any heavyweight reasoning starts. Phase A is graph-grounded reconnaissance; Phase B is a sequence of structured-options cards, one section at a time. Each card lists 3–4 mutually-exclusive options; the analyst clicks the matching choice.
Phase A — Reconnaissance (no analyst input). The assistant runs semantic_search against all three graphs and explore_node on the verified Iberia node, then auto-fills the Entry Points table (Iberia → Operator, the involved aircraft types, the airport ICAOs) and the Domain Terms section (decoded ECCAIRS codes from search_ontology).
Phase B — Section cards (analyst chooses one option per card). The script's recommended choices below produce the comprehensive cross-graph briefing the rest of the demo expects.
| # | Section | Question | Options | Recommended choice |
|---|---|---|---|---|
| 1 | Initial question | "Use the assistant's suggested investigation question, or enter your own?" | (free-text confirmation) | "yes, that question works" |
| 2 | Objective | "Focus on all risk dimensions, or prioritize one area?" | All risk dimensions / Maintenance-focused / Fleet-specific risk / Regulatory gap | All risk dimensions |
| 3 | Scope — temporal | "RFI mentions 2024 specifically. Should we…" | 2024 data only / 2024 with historical context / Extended window (2023-2024) | 2024 data only |
| 4 | Scope — geographic | "Iberia incidents at LEMD, BCN, PMI, BIO, and one diversion to LYS. Geographic scope?" | Spanish operations focus / Madrid hub-centric / All incident locations | All incident locations |
| 5 | Scope — fleet | "2024 incidents involve A320, A321, A330, A350. Fleet scope?" | All Airbus types / Narrow-body focus (A320 family) / Incident-specific aircraft | Narrow-body focus |
| 6 | Graph Strategy | "Cross-reference strategy across the three graphs?" | Exhaustive coverage / Gap detection / Lifecycle chain / Exhaustive with gap escalation | Exhaustive coverage |
| 7 | Expected Output — format | "Output format for a 7-incident risk profile?" | Risk matrix / Comprehensive report / Tabular analysis / Executive narrative | Comprehensive report |
| 8 | Expected Output — depth | "Detail level?" | Detailed (specific incidents + citations) / Comprehensive (deep-dive + cross-references) | Comprehensive |
| 9 | Expected Output — must-include | "Which elements must appear?" | Systemic clusters + maintenance signals / Fleet-specific regulatory coverage / Prioritized recommendations / All comprehensive elements | All comprehensive elements |
| 10 | Constraints | "Any specific exclusions?" | 2024 scope limitation / Iberia mainline only / No specific constraints / Other constraints | No specific constraints |
Phase C — Approval. The completed briefing renders with all eight sections filled (Objective, Scope, Entry Points, Domain Terms, Graph Strategy, Expected Output, Constraints, Analyst Decisions). The analyst types "approved, proceed with the investigation"; the briefing transitions Draft → IN_REVIEW → APPROVED. The assistant then asks once more "Would you like to start the investigation now?" — the analyst confirms with "yes, start the investigation now".
| Capability | What's being tested |
|---|---|
| Elicitation as graph-grounded dialogue | Recon happens before asking the analyst anything |
| Auto-populated sections | Domain Terms decoded from the ontology graph; Entry Points verified from the connector |
| Cross-graph scope expansion | "Exhaustive coverage" choice (card 6) commits the briefing to query all three graphs |
| Confirmation gate | The agent never starts the reasoning loop without an explicit "yes, start the investigation" — the briefing-approved state is necessary but not sufficient |
Live presenter
The Operator Risk Profile briefing has the anchor verbs the audience needs to see: Objective, Scope, Entry Points, Graph Strategy. Walk through them on screen as the elicitation completes — this is the moment the audience sees the difference between "chat with the data" and "investigate the data". The 10 cards typically run in ~3 minutes; each click triggers an update_briefing_content call you can point at as on-screen evidence that the briefing document is being filled live, not buffered.
Q15 — Watch the investigation run (no prompt; agent autonomy)
The reasoning agent (Phronesis) runs autonomously. The investigation graph populates incrementally in the workspace as the planner-executor loop progresses through plan → execute → observe → converge. Tool calls (Cypher, semantic search, ontology lookups) are visible inline; nothing is silent. The status panel shows the loop state: Planning → Executing → Synthesizing → Verifying → Complete.
| Capability | What's being tested |
|---|---|
| Reasoning autonomy with audit | The agent makes decisions; PROV-O records every one |
| Live investigation graph | The audience watches the case being built — ToolCall and Finding nodes appear in real time |
| Adaptive replanning | If a tool returns an unexpected result shape, the planner replans — the cycle counter increments, the investigation does not crash |
Live presenter
For the Operator Risk Profile briefing the investigation typically runs 3–5 minutes and executes 10–20 autonomous tool calls (mostly run_cypher against aviation_safety, with search against safety_recommendations/airworthiness_directives for cross-graph coverage). The cycle counter (e.g. "Planning (cycle 8)") reflects replans, not raw step count — a healthy investigation may go through 15–20 cycles. Don't interrupt it. The pace is part of the value: this is what "think for me" looks like — measured, inspectable, with intermediate observations recorded.
Operational rule
Phronesis caches MCP sessions to each connector at startup. If a connector is restarted while Phronesis is up, its session goes stale (the connector returns "Unknown tool" on the first call). Whenever a connector restarts, restart aletheia-reasoning too before starting an investigation. Auto-reconnect on Session terminated is a known follow-up in aletheia/discovery/client.py.
Q16 — Show the investigation graph
"Show me the investigation graph."
The PROV-O investigation graph renders as an independent UI component, like the network graph in Block 2 but scoped to the run.
| Capability | What's being tested |
|---|---|
| PROV-O investigation graph | Each plan/execute/observe step is a node; their wiring is the audit trail |
| Replay-ready | The analyst can step through the investigation post-hoc |
Q17 — Save the briefing and investigation
"Save the briefing and the investigation results in the Iberia folder."
Two artifacts are written to the existing Iberia/ folder (created in Q12). The assistant generates each as a markdown file: the briefing as the structured Operator Risk Profile document; the investigation results as the synthesized analyst-facing report (Executive Summary, Cluster analyses, Regulatory Gap, Recommendations, Claims).
📁 Workspace now contains: - 2025 Annual Review/Recurring Patterns 2024.md - 2025 Annual Review/Iberia hydraulic pattern.md - Iberia/2024-incident-network.graph - Iberia/Iberia Risk Profile Briefing 2024.md - Iberia/Iberia 2024 Consolidated Risk Assessment.md
Block close. "The investigation surfaced an open EASA Safety Recommendation directly applicable to the maintenance-audit gap, plus two more from the broader regulatory inventory that several operators in our 2024 corpus haven't yet implemented. Now I need to decide which we can fund."
Block 4 — "Decision: which recommendations do we fund?"
Decision agent (Euboulia). Goal: turn the analyst's accumulated portfolio (gap-analysis findings + EASA-derived recommendations) into a budget-bounded action plan.
Block opener. "From triage and the Iberia deep dive I have a candidate portfolio of safety actions, plus the EASA recommendations the investigation surfaced. Five-million-euro annual budget. Let me frame this for the decision agent."
🆕 New chat — chat 6 of 6
Open a fresh chat in the workbench before Q18. The Euboulia 8-stage decision pipeline that follows is one continuous conversation through Q21 — do not open another chat mid-pipeline. A clean starting context is essential because each pipeline stage's output is the next stage's input (analyzer → extractor → formulator → coder → assembler → executor → verifier → interpreter); contaminating it with Block 3's Phronesis state would derail the formulation.
Q18 — Frame the decision
"We have a candidate portfolio of safety actions: the Iberia maintenance audit, the ERJ-195 DMC software bulletin push, the Frankfurt 25L wildlife management upgrade, and three EASA-derived recommendations from the gap analysis. Each has an estimated implementation cost and an expected risk reduction. Help me decide which to implement under our €5M annual safety improvement budget — maximize total risk reduction."
Euboulia (the decision agent) is invoked. The 8-stage pipeline begins: analyzer → extractor → formulator → coder → assembler → executor → verifier → interpreter. The first three stages are gated by short approval prompts ("Does this problem statement capture what you're trying to solve?", "Are the extracted parameters correct and complete?", "Are the constraints and objective correctly identified?") — the analyst clicks through with Yes, proceed, Parameters look good, Constraints and objective are correct.
The analyst supplies the per-action input data when the executor stage asks for it:
| # | Action | Cost (€) | Risk reduction |
|---|---|---|---|
| 1 | Iberia maintenance audit | 1,200,000 | 100 |
| 2 | ERJ-195 DMC software bulletin push | 350,000 | 25 |
| 3 | Frankfurt 25L wildlife management upgrade | 2,800,000 | 60 |
| 4 | EASA recommendation #1 (from gap analysis) | 600,000 | 40 |
| 5 | EASA recommendation #2 (from gap analysis) | 1,500,000 | 50 |
| 6 | EASA recommendation #3 (from gap analysis) | 450,000 | 20 |
MaxBudget = 5,000,000. Total cost if all six were selected: €6.9M — the budget binds, so the optimizer must choose. (Risk reduction is a dimensionless score; the units are arbitrary as long as they are consistent across rows.)
| Capability | What's being tested |
|---|---|
| Decision agent invocation | A natural-language portfolio question becomes a formal optimization problem |
| Inline parameter extraction | Costs and risk reductions are surfaced in Stage 2 (extractor) for analyst review before solving |
| Stage gating with cheap approvals | Each early stage has a one-click confirmation; the analyst can revise before the solver runs |
Q19 — Inspect the formulation
"Walk me through the formulation: what's the objective function, what are the constraints, what are the decision variables?"
The decision agent renders its problem as KaTeX — visible math, not a black box. The Problem panel header classifies it as BIP — Binary Integer Program, 1 binary variable, 2 constraints, 4 parameters (N, Cost, RiskReduction, MaxBudget), solver CVXPY (CBC backend).
The formulation is a 0-1 knapsack:
- Decision variables: $\text{Select}_i \in {0, 1}$ for $i \in {1, \ldots, N}$ — one per candidate. Selected at most once (binary).
- Objective: $\max \sum_{i=1}^{N} \text{RiskReduction}_i \cdot \text{Select}_i$
- Budget constraint: $\sum_{i=1}^{N} \text{Cost}_i \cdot \text{Select}_i \leq \text{MaxBudget}$, with $\text{MaxBudget} = 5{,}000{,}000$.
The formulate_clause stage emits each clause with a confidence score (5/5 expected for this problem). After the analyst accepts ("Model is correct"), the coder stage generates the CVXPY Python script, which the analyst can inspect under the Code tab before it runs.
| Capability | What's being tested |
|---|---|
| Transparent LP/MILP | The optimization is visible — the analyst sees what's being solved |
| Decision-as-conversation | Formulation review is an ordinary turn, not a hidden step |
| Per-clause confidence | The formulator publishes its uncertainty so low-confidence clauses can be revised before the solver runs |
Live presenter
The KaTeX rendering is the audience-facing proof that this is real optimization, not LLM hand-waving. Pause briefly on the math, then click the Code tab — the generated CVXPY script is also visible. The audience sees the entire chain: prose → math → code → solver result.
Q20 — Run the optimization
"Run the optimization. Show me the optimal portfolio with the rationale for each item picked and rejected."
Stages 6–8 of the pipeline run: executor solves the BIP via CVXPY in a sandboxed subprocess, verifier confirms the solution against the constraints, interpreter renders the analyst-facing artifact. The Solution panel header reads optimal; the Objective Value reads 235.
The optimal portfolio for the Q18 input data:
| # | Action | Cost (€) | Risk reduction | Decision |
|---|---|---|---|---|
| 1 | Iberia maintenance audit | 1,200,000 | 100 | ✅ Selected |
| 2 | ERJ-195 DMC software bulletin push | 350,000 | 25 | ✅ Selected |
| 3 | Frankfurt 25L wildlife management upgrade | 2,800,000 | 60 | ❌ Rejected |
| 4 | EASA recommendation #1 | 600,000 | 40 | ✅ Selected |
| 5 | EASA recommendation #2 | 1,500,000 | 50 | ✅ Selected |
| 6 | EASA recommendation #3 | 450,000 | 20 | ✅ Selected |
Portfolio summary: 5 of 6 actions implemented · total cost €4.1M of €5M (82% utilization, €900K slack) · total risk reduction 235 units · 1/1 constraints verified.
Why Frankfurt 25L was excluded: at €2.8M it would consume the entire remaining budget after the other five (which together cost €4.1M and deliver risk reduction 235); swapping any selected item for Frankfurt would lower the objective. The interpreter renders the rationale inline in plain English, sourced from the optimizer's primal/dual values — not an LLM rationalization.
| Capability | What's being tested |
|---|---|
| End-to-end BIP via Euboulia | Eight pipeline stages, visible per-stage progress |
| Verifier as a separate stage | The solver's optimality claim is checked against the constraints before the interpreter renders the artifact |
| Per-item rationale in plain English | The output is operationally readable, not an LP solver dump |
Q21 — Save the decision
"Save the decision file as '2026 Safety Investment Plan' in the Annual Review folder."
The decision is persisted to the Annual Review folder as a structured document. This is the artifact the analyst hands to leadership.
📁 Workspace at the end of the demo: - 2025 Annual Review/Recurring Patterns 2024.md - 2025 Annual Review/Iberia hydraulic pattern.md - 2025 Annual Review/2026 Safety Investment Plan.md - Iberia/2024-incident-network.graph - Iberia/Iberia Risk Profile Briefing 2024.md - Iberia/Iberia 2024 Consolidated Risk Assessment.md
Block close. "That's the case for the budget meeting. The triage gave me the population. The Iberia investigation gave me the audit trail. The decision agent gave me the portfolio. The system did not decide — I did. But every step is reproducible."
L. Summary
The demo follows an analyst's arc: triage → deep dive → structured investigation → decision. Each block adds capabilities; the cumulative work product is a folder of saved artifacts.
Capabilities by block
| Block | Graphs | Capabilities introduced |
|---|---|---|
| 1 — Patterns of the quarter | aviation_safety | Triage aggregation, workspace doc save + live edit, chart, map, ECCAIRS jargon decode via the searchable ontology |
| 2 — Iberia deep dive | + safety_recommendations + airworthiness_directives | Operator timeline + profile (direct execution, not briefing), cross-graph fan-out, regulatory gap detection, network graph as independent UI |
| 3 — Structured investigation | three graphs + ontology | Briefing template registry (profile-gated), elicitation flow (recon → one-question-at-a-time → entry-point verification → auto-decoded domain terms → cross-graph detection → approval), reasoning-agent autonomy with PROV-O audit, investigation graph as independent UI |
| 4 — Decision: which recommendations do we fund? | three graphs + ontology + decision agent | LP/MILP optimization via Euboulia, KaTeX-rendered formulation, per-item rationale, decision file as the closing artifact |
The arc
Block 1: "Find me something." Block 2: "Connect these." Block 3: "Investigate this." Block 4: "Decide for me."
The system did not decide. The analyst did. But every step is reproducible from saved artifacts and PROV-O records.
Workspace at the end
2025 Annual Review/
├── Recurring Patterns 2024.md
├── Iberia hydraulic pattern.md
├── 2026 Safety Investment Plan.md
└── Iberia/
    ├── network graph
    ├── Operator Risk Profile briefing
    └── investigation graph
That's the case for the budget meeting.